
This article describes the Dashboard that was in Korbyt before version 3.0 and is maintained for any legacy On-Prem Users who have an older version
In this article, we will be showing one of the core features of the Korbyt CMS, the Dashboard.
This is the main landing area you will see any time you log on to the Korbyt platform.
The Dashboard is where you can get at glance observation of the status of your digital signage and KorbytGo.
After reading this article the user will comfortably be able to navigate around the Dashboard and learn the value of its many configurable widgets
The picture below will show the Dashboard and how is broken up onto three different sections.
Quick Look area – is at the top of the screen
Operational widgets – in the middle
Deeper Insights
Top 10 KorbytGo content widgets – towards the bottom
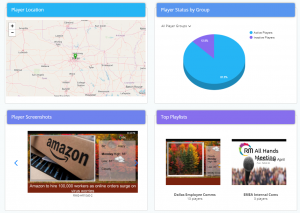
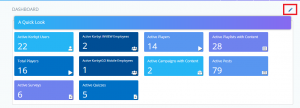
Quick look Area
In this Area, you can see the quick total values related to the overall Korbyt network. Here you can also see the items such as the number of active Korbyt users, number of active players, or playlists with content.

Top
***
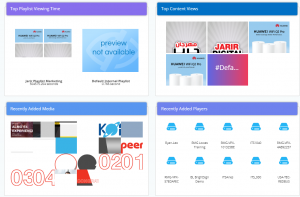
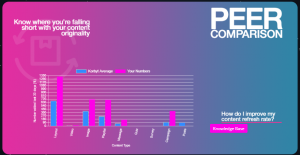
Operational Widgets Area
This Area is towards the middle of the page. This area is where you find widgets related to digital content and its methods of delivery. These widgets include items such as active players’ screenshots, media added in the last 30 days, and top content views.
Top
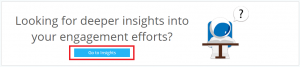
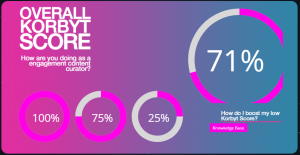
Deeper Insights
This Area is towards the middle of the page. This area is where you find deeper insights into your engagement efforts
Within the insights you should be able to see Most Popular
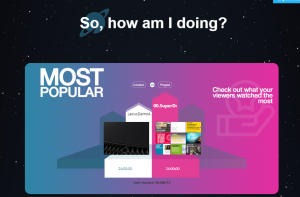
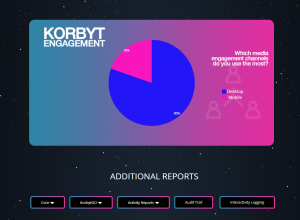
As you keep scrolling down the window, there will be more options to display
With in Korbyt Engagement you will be able to preview additional reports for Core, KorbytGo, Activity reports, Audit trail, Interactivity Logging and Player Inventory
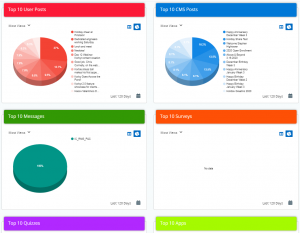
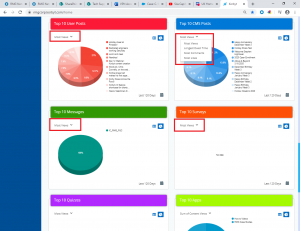
Top 10 KorbytGo Content Widgets
Towards the bottom of the screen, we have our top 10 KorbytGo widgets.
Please note: You must have KorbytGo enabled to see these options. The 10 pie charts will show Korbyt metrics such as Top 10 users posts, Top 10 CMS Posts, Top 10 Messages, Top 10 surveys, Top 10 Quizzes, Top 10 Apps, top 10 Tags or top 10 most proactive Korbyt Go users.
- Each widget, you can use the drop-down to select different options to View
- All the Top 10 Options include the same drop-down list: Most Views, Longest Dwell Time, Most Comments, and Most Likes.
Top
***
Overall Dashboard
One key feature of the dashboard is the ability to customize the layout.
Using the Pencil icon, you can toggle or hide any of the widgets of the display. \
Green shows the items is enable to display. Red shows the item is not enabled to display.
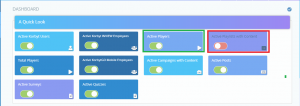
Select the ones you want to hide or show and click on the same check mark to save the changes