Our Knowledge Base Has Moved
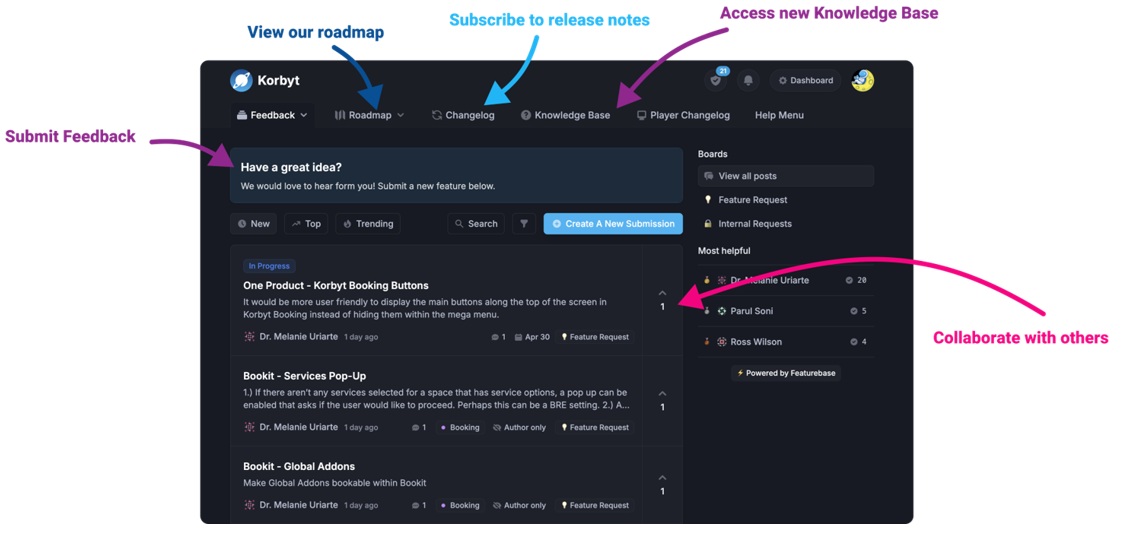
The New Page landing page for the Knowledge Base is https://product.korbyt.com/help
Guides for the Elements can be found at: https://product.korbyt.com/help/articles/6713513-layout-and-message-builder-elements
Please update any of your bookmarks to the new Knowledge Base
For assistance on using the new Knowledge Base, we have a Welcome to the New Korbyt Knowledge Base guide
The new Korbyt Product Page also has sections for submitting feedback on system improvements, a view of our Roadmap of upcoming enhancements, and a change log of all updates.
What is the Chart Element?
The Chart Element allows you to display data from a Data Adapter or manually entered data in a chart format.

When you add a chart to a Builder canvas is will create a generic graph that you can then edit by Opening the Settings Gear in the upper right and then clicking Edit Element
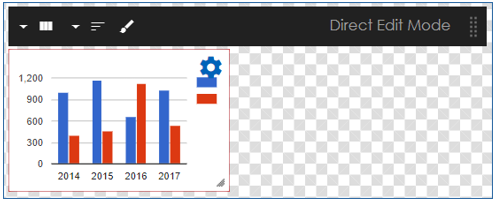
Chart Element options
![]()
You can now adjust the following options:
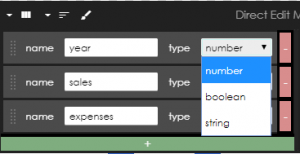
Columns ![]()
This allows you to adjust the column name and data type
Data ![]()
This allows you to manually put in the data of the chat you wish to display.
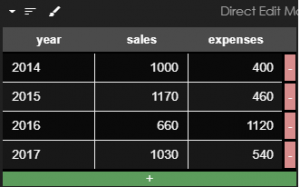
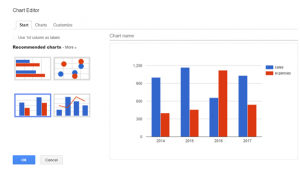
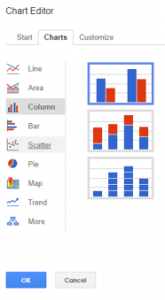
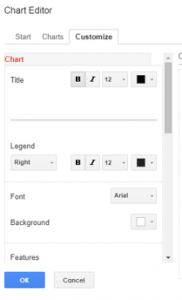
Chart Editor ![]()
This allow you to customize your chart on how it displays:
Charting Data from an Adapter
Instead of manually entering data you can set up a subscription, and what data you wish to present.
Once that is set up, you can drag the subscription on top of the Chart Element and it will update the chart and dynamically update as the data updates.
To see how to create a Data Subscription in the Builder Tool see How to Add Data into a Layout or Message

